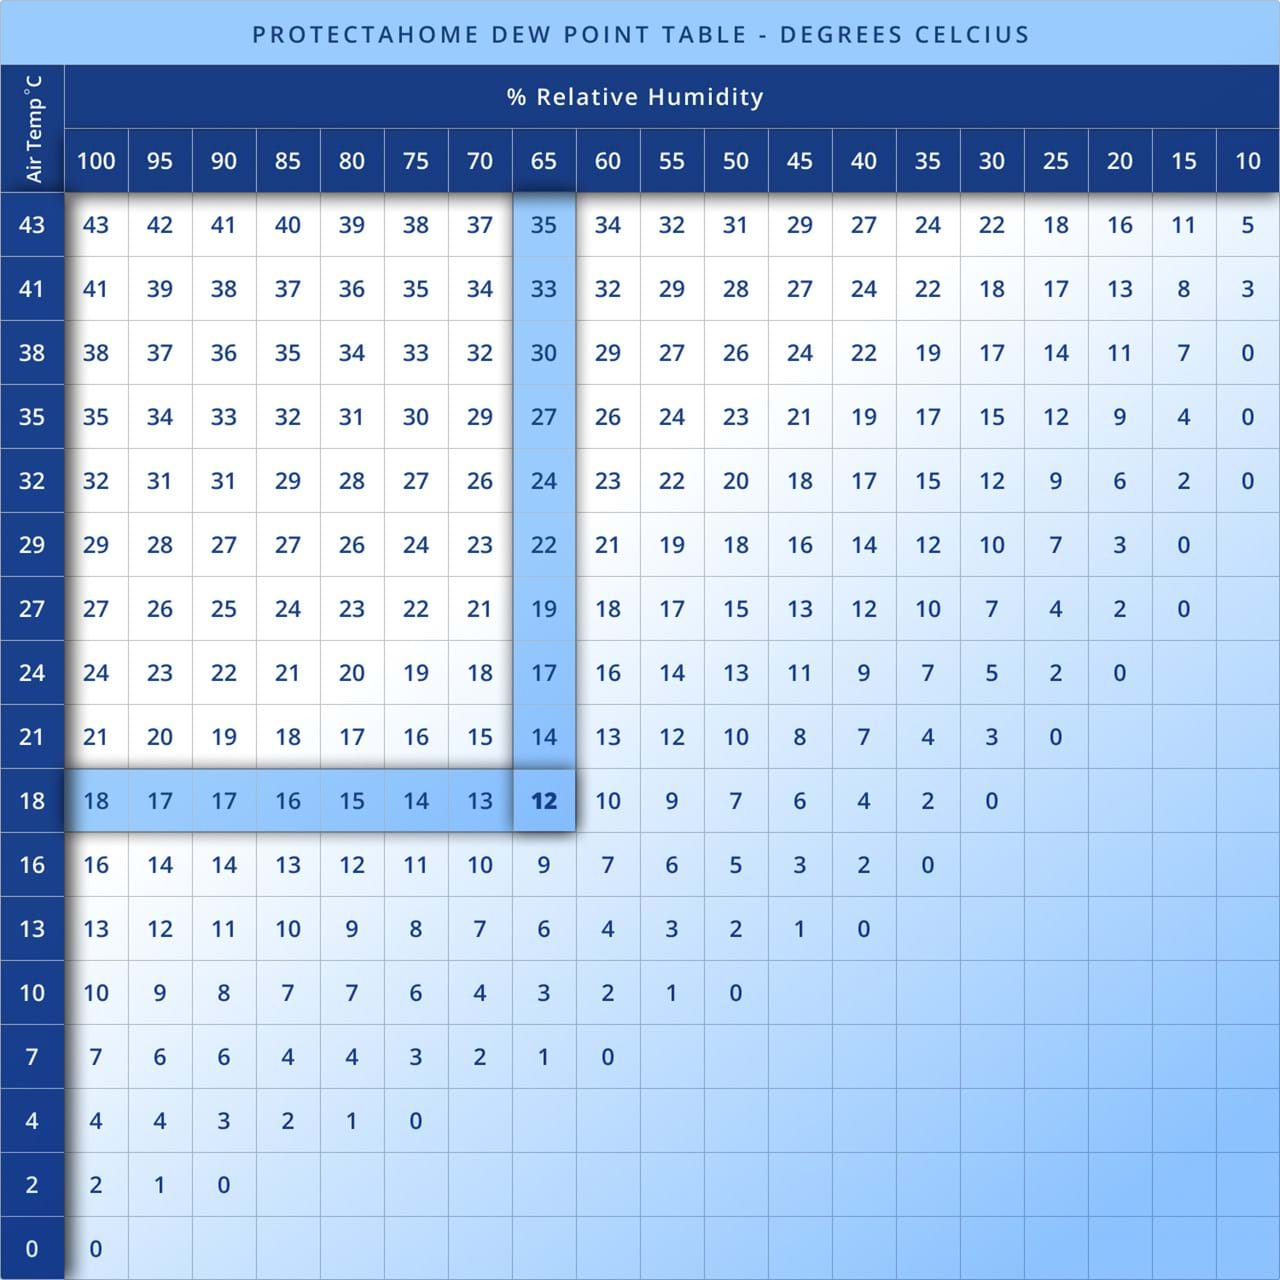
The dew point chart is an essential tool in meteorology, engineering, and various other industries. It provides a visual representation of the temperature at which air becomes saturated with moisture, leading to condensation. Understanding how to read and use a dew point chart is crucial for making informed decisions in weather prediction, HVAC system design, agriculture, and more.
What is Dew Point?
Dew point is the temperature at which air reaches 100% relative humidity. At this point, the air cannot hold any more moisture, and water vapor begins to condense into liquid water. This phenomenon can be observed as dew, fog, or frost depending on the surrounding conditions. Unlike relative humidity, which fluctuates with temperature, dew point provides a consistent measure of moisture in the air.
Why is the Dew Point Important?
Understanding the dew point has practical applications across various fields:
-
Weather Forecasting: A high dew point indicates a humid atmosphere, often leading to thunderstorms or heavy rain.
-
Comfort Levels: Dew point directly impacts how comfortable the air feels. Higher dew points correspond to muggy, oppressive conditions.
-
Agriculture: Farmers monitor dew points to prevent crop damage from frost or mold growth.
-
HVAC Systems: Engineers design heating, ventilation, and air conditioning systems based on dew point readings to ensure efficient operation and prevent condensation issues.
How to Read a Dew Point Chart
A dew point chart typically consists of a grid with relative humidity (%) on one axis and air temperature (°F or °C) on the other. The chart helps determine the dew point by locating the intersection of these two variables. Here’s a step-by-step guide:
Identify Air Temperature: Measure the current air temperature using a thermometer.
Determine Relative Humidity: Use a hygrometer to find the relative humidity.
Locate the Intersection: Find the point on the chart where the temperature and relative humidity values intersect. This point represents the dew point temperature.
For example, if the air temperature is 25°C and the relative humidity is 60%, the dew point temperature might be approximately 16°C.
Interpreting the Dew Point Chart
The dew point chart can reveal critical insights:
-
High Dew Points (>20°C or 68°F): Indicate humid conditions that may feel uncomfortable and lead to thunderstorms.
-
Moderate Dew Points (10–20°C or 50–68°F): Represent pleasant conditions for most people.
-
Low Dew Points (<10°C or 50°F): Suggest dry air, often associated with cooler and crisp weather.
Applications of Dew Point Charts
Weather Prediction
Meteorologists use moutain dew point generator to predict fog, frost, or precipitation. By comparing dew point and air temperatures, they can determine when and where condensation might occur.
Aviation
Pilots rely on dew point readings to anticipate weather conditions such as fog, which can impact visibility during takeoff and landing.
HVAC System Design
In building design, engineers use dew point data to ensure that HVAC systems prevent condensation on walls, windows, and ducts, reducing the risk of mold growth.
Food Storage and Transportation
Maintaining specific dew point levels is crucial for storing perishable goods. A dew point chart helps ensure optimal conditions for preserving freshness.
Industrial Processes
Industries such as pharmaceuticals and chemical manufacturing monitor dew points to maintain quality control and avoid unwanted condensation.
Limitations of Dew Point Charts
While dew point charts are highly useful, they have limitations:
-
Static Nature: Dew point charts are based on fixed temperature and humidity values, requiring recalibration for dynamic environments.
-
Limited Accuracy: Readings depend on precise measurements of temperature and humidity. Any errors in these measurements can affect dew point accuracy.
-
Regional Variations: Different climates may require tailored charts for optimal results.
Modern Alternatives to Dew Point Charts
With technological advancements, digital tools and apps can calculate dew points more quickly and accurately than manual charts. Devices like weather stations and hygrometers often include built-in dew point calculations. However, the basic principles of using a dew point chart remain foundational knowledge for understanding these readings.
How to Create Your Own Dew Point Chart
Creating a customized dew point chart can be useful for specific needs:
Collect Data: Gather temperature and humidity readings over time.
Use a Formula: Calculate the dew point using a standard formula, such as:
Where:
-
Td = Dew Point Temperature
-
T = Air Temperature (°C)
-
RH = Relative Humidity (%)
Plot Values: Plot the calculated dew points on a graph with temperature on one axis and relative humidity on the other.
Practical Tips for Using Dew Point Charts
-
Pair with Weather Tools: Use dew point charts alongside barometers and weather radars for a comprehensive analysis.
-
Regular Calibration: Ensure your temperature and humidity measuring devices are calibrated for accurate readings.
-
Educate Yourself: Familiarize yourself with typical dew points in your region to anticipate seasonal weather patterns.
Conclusion
The dew point chart is a vital resource for understanding atmospheric moisture and its effects. By learning to interpret this tool, you can make better decisions in weather forecasting, agriculture, HVAC design, and beyond. Whether you use traditional charts or modern digital tools, mastering the concept of dew point ensures you stay prepared for any environmental challenges.


